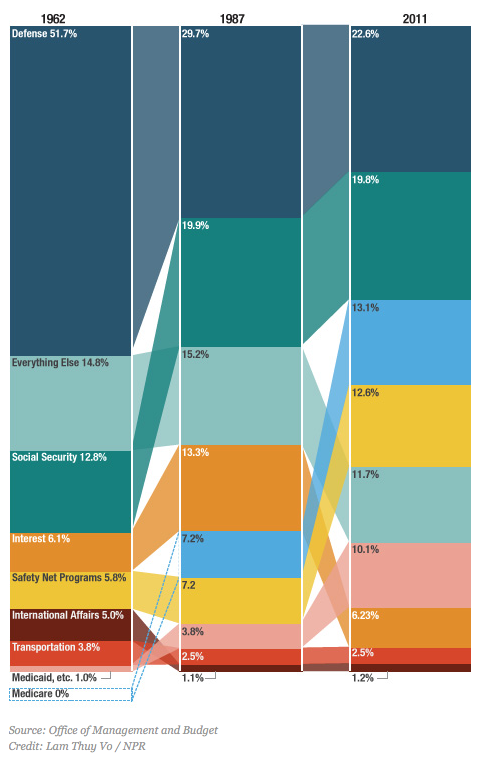
This relevant and amazing piece of information design by Lam Thuy Vo shows 50 years of US government spending in one graph using numbers from the Office of Management and Budget.
- Home
- Client Login
- Resources
- Student Login
- Courses
- Registration
- Students & Alumni
- Privacy & Terms
- RSS
- Studio!
